
Ielts Writing Task 1 Sample Answer – আইইএলটিএস রাইটিং টাস্ক ১-এ ডায়াগ্রাম, চার্ট, গ্রাফ বা টেবিল থাকে। পরীক্ষার্থীরা এই তথ্য বিশ্লেষণ করে ১৫০ শব্দ লিখতে হয়।
Academic এবং General ট্রেনিং মডিউল-এর টাস্ক ১ ভিন্ন। অকাডেমিক মডিউলে chart বা diagram বিশ্লেষণ করতে হয়। জেনারেল ট্রেনিং মডিউলে letter করতে হয়।
২০ মিনিট সময়ে টাস্ক ১ শেষ করতে হবে। প্রথমে, তথ্য বিশ্লেষণ করে নিন। তারপর মূল পয়েন্টগুলি চিহ্নিত করুন।
প্রথম ৫ মিনিট তথ্য বিশ্লেষণ এবং মূল পয়েন্ট চিহ্নিত করতে ব্যয় করুন। পরবর্তী ১০ মিনিট লেখা শুরু করুন। শেষ ৫ মিনিট রিভিউ করার জন্য রাখুন।
IELTS Writing Task 1 Samples Academic with Answers

Types of IELTS Writing Task 1 (Academic)
Bar Chart Model Answer:
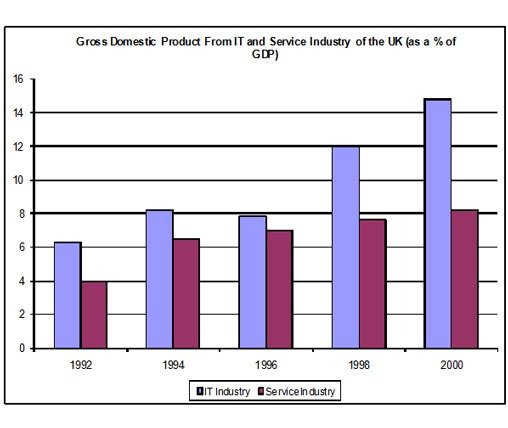
The bar chart illustrates the gross domestic product generated from the IT and Service Industry in the UK from 1992 to 2000. It is measured in percentages. Overall, it can be seen that both increased as a percentage of GDP, but IT remained at a higher rate throughout this time.
At the beginning of the period, in 1992, the Service Industry accounted for 4 per cent of GDP, whereas IT exceeded this, at just over 6 per cent. Over the next four years, the levels became more similar, with both components standing between 6 and just over 8 per cent. IT was still higher overall, though it dropped slightly from 1994 to 1996.
However, over the following four years, the patterns of the two components were noticeably different. The percentage of GDP from IT increased quite sharply to 12 in 1998 and then nearly 15 in 2000, while the Service Industry stayed nearly the same, increasing to only 8 per cent.
At the end of the period, the percentage of GDP from IT was almost twice that of the Service Industry.
ieltsbuddy.com
Line Graph Model Answer:
howtodoielts.com
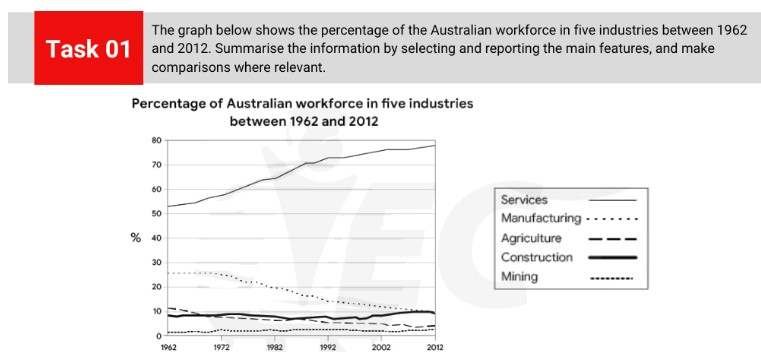
The line chart details the percentage of workers in Australia according to 5 different industries from 1962 to 2012. Looking from an overall perspective, it is readily apparent that the most noticeable growth and the vast majority of jobs was concentrated in the services industry. There was decline in the workforce for jobs in agriculture and manufacturing, and slight rises for the remaining two industries.
In 1962, approximately 52% of Australians worked in services, a figure far above the next closest sector, manufacturing (27%). From that point onwards, service jobs grew rapidly to reach 72% by 1992 and then growth tapered off and rose more moderately to finish the period at just under 80%. In contrast, manufacturing as an employment option was stable over the first decade before a consistent decline led to a final figure of 10% in 2012.
In terms of the less common jobs, agricultural workers declined at steady intervals from just above 10% in 1962 to a low of 4% in 2012. In comparison, mining and construction jobs were generally stable with minor growth, rising from 9% and 1% to 10% and 2%, respectively.
Pie Chart Model Answer:
ieltsbuddy.com
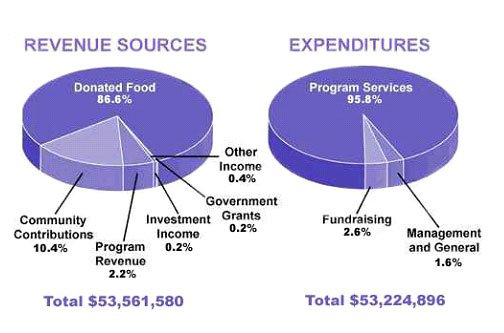
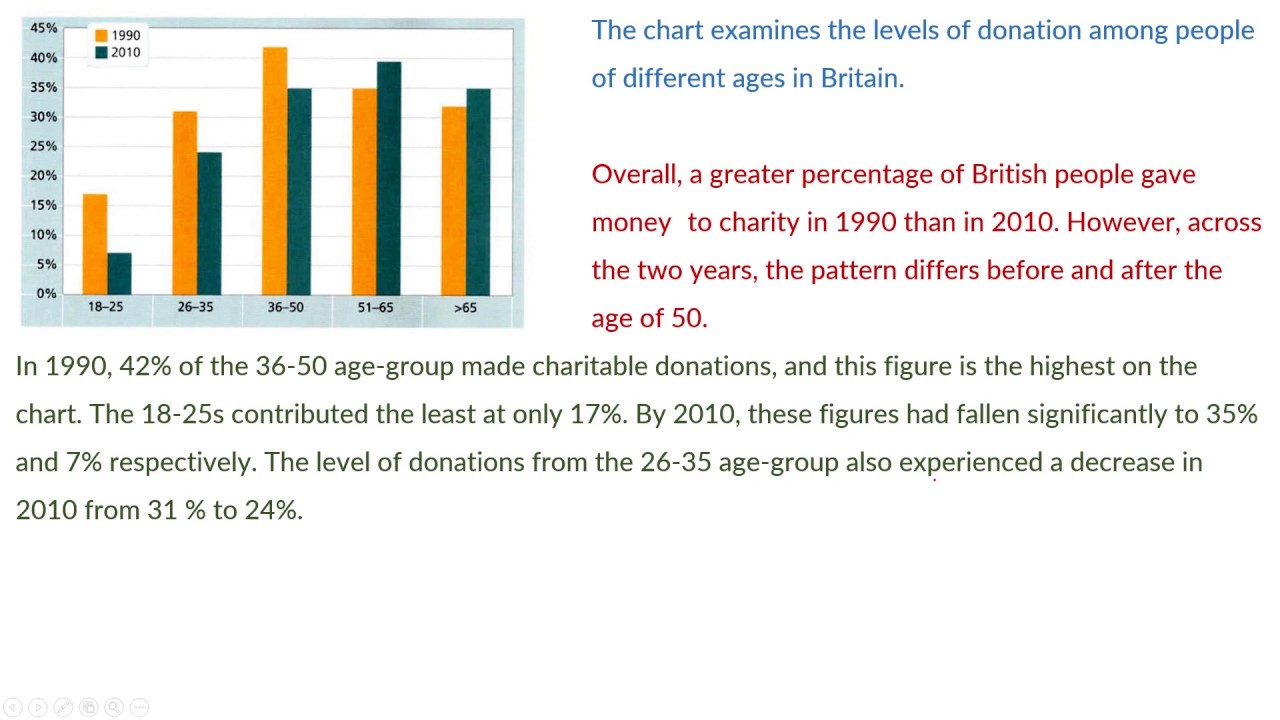
The pie charts show the amount of revenue and expenditures in 2016 for a children’s charity in the USA. Overall, it can be seen that donated food accounted for the majority of the income, while program services accounted for the most expenditure. Total revenue sources just exceeded outgoings.
In detail, donated food provided most of the revenue for the charity, at 86%. Similarly, with regard to expenditures, one category, program services, accounted for nearly all of the outgoings, at 95.8%.
The other categories were much smaller. Community contributions, which were the second largest revenue source, brought in 10.4% of overall income, and this was followed by program revenue, at 2.2%. Investment income, government grants, and other income were very small sources of revenue, accounting for only 0.8% combined.
There were only two other expenditure items, fundraising and management and general, accounting for 2.6% and 1.6% respectively. The total amount of income was $53,561,580, which was just enough to cover the expenditures of $53,224,896.
Diagrams Model Answer
ieltsbuddy.com
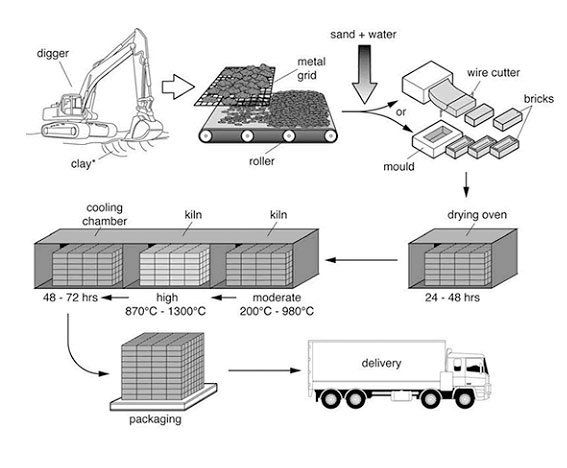
The diagram explains the way in which bricks are made for the building industry. Overall, there are seven stages in the process, beginning with the digging up of clay and culminating in delivery.
To begin, the clay used to make the bricks is dug up from the ground by a large digger. This clay is then placed onto a metal grid, which is used to break up the clay into smaller pieces. A roller assists in this process.
Following this, sand and water are added to the clay, and this mixture is turned into bricks by either placing it into a mould or using a wire cutter. Next, these bricks are placed in an oven to dry for 24 – 48 hours.
In the subsequent stage, the bricks go through a heating and cooling process. They are heated in a kiln at a moderate and then a high temperature (ranging from 200c to 1300c), followed by a cooling process in a chamber for 2 – 3 days. Finally, the bricks are packed and delivered to their destinations.
IELTS Map Model Answer
ieltsbuddy.com
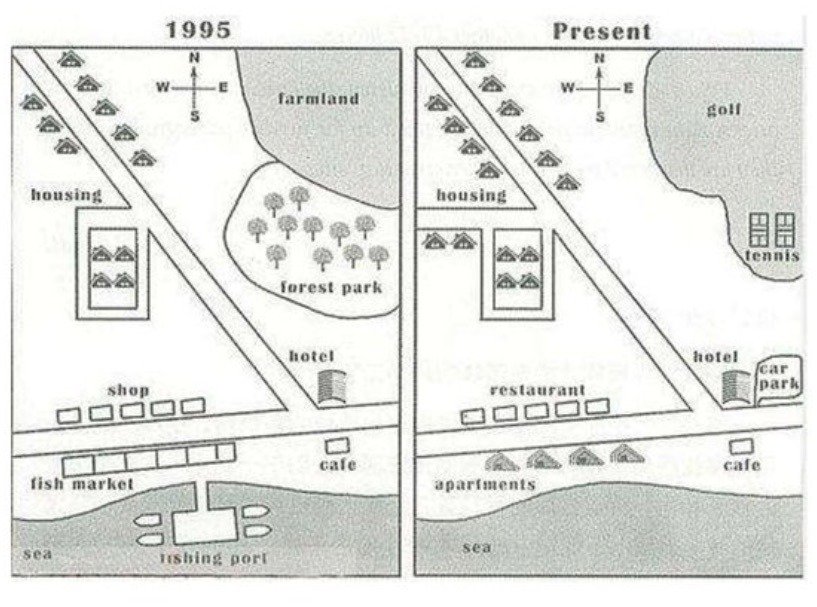
The map shows how a village called Ryemouth has developed over the last twenty-five years. There have been several changes, the most noticeable being the increases in accommodation, the elimination of the fishing industry, and the introduction of sports facilities.
In 1995, to the south of the village where the sea is there was previously a fishing industry, with a fishing port and quite a large fish market as well. Next to this was a small cafe. On the other side of the road running by the sea stood a line of five shops and a hotel, while situated in the north east part of the village was farmland and a park with trees. The main housing of the village was located in the north west around a main road that runs from the coastal road, with twelve houses, four of them encircled by a smaller side-street.
Turning to the present day map, it can be seen that the fishing facilities have all gone, being replaced by four apartments, and the shops have become restaurants. The cafe remains, as does the hotel, albeit with parking facilities which it did not have before. Having been converted into a golf course, the farmland has now gone, while the forest park has been removed to make way for tennis courts. Although the old houses remain, new ones have been built, along with a new road with two new houses beside it.
Chart and Graph Analysis
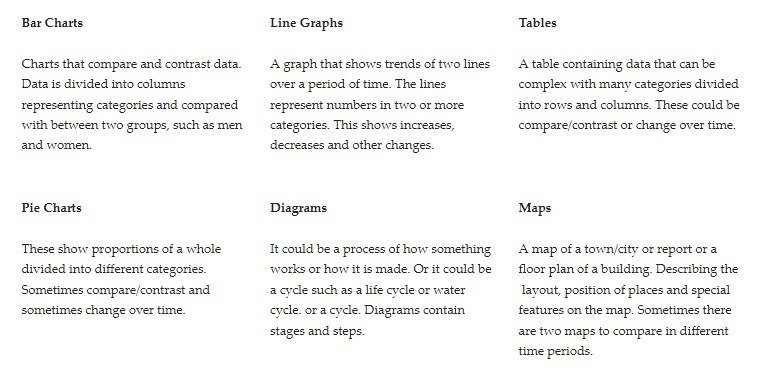
Bar Chart তথ্য গুলো আনুভূমিক বা উল্লম্ব বার দিয়ে প্রদর্শিত হয়। প্রতিটি বার একটি ডাটা পয়েন্ট প্রতিনিধিত্ব করে। বার চার্ট গুলোর উচ্চতা বা দৈর্ঘ্য ডাটা মানকে নির্দেশ করে। সহজে তুলনা করার জন্য বার চার্ট কার্যকরী।
Line Graph ডাটা পয়েন্ট গুলো লাইন দিয়ে সংযুক্ত থাকে। লাইন গ্রাফ সময়ের সাথে পরিবর্তন দেখাতে সহায়ক। এটি সময়ের ক্রমাগত পরিবর্তন দেখায়। ডাটা পয়েন্টগুলোর মধ্যে সংযোগ স্থাপন করে লাইন গ্রাফ।
Pie Chart বৃত্তাকার আকারে প্রদর্শিত হয়। এটি পুরো অংশকে বিভিন্ন ভাগে বিভক্ত করে। প্রতিটি ভাগ একটি ডাটা পয়েন্ট প্রতিনিধিত্ব করে। পাই চার্ট মোটের অনুপাত দেখাতে সাহায্য করে। এটি সাধারণত শতকরা হার প্রদর্শনে ব্যবহৃত হয়।
Credit: m.youtube.com
Recommended Read:
C1 Level English IELTS Score: A Score Comparison
Ielts Marking System – How they are calculated
5.5 IELTS Score University in USA
Without IELTS Study in Europe – Study in Top European Universities
Study in Usa From Bangladesh – Killer Steps
Writing Tips:
Understand how the test is marked – পরীক্ষাটি কীভাবে মূল্যায়ন করা হয় তা বুঝুন। মূল্যায়ন মানদণ্ডগুলি জানা আপনাকে পরীক্ষককে ঠিক যা তারা চায় তা দেওয়ার সুযোগ করে দেবে।
Paraphrase the question– প্রথম অনুচ্ছেদে প্রশ্নটিকে প্যারাফ্রেজ করা শ্রেয়। আপনি এটি করতে পারেন সমার্থক শব্দ ব্যবহার করে।
Write the overview– ওভারভিউ লেখার জন্য, প্রধান বৈশিষ্ট্যগুলির মধ্যে ৩ বা ৪টি বেছে নিন এবং ডেটা উল্লেখ না করে সেগুলি সম্পর্কে সাধারণভাবে লিখুন।
Support the main features-নতুন একটি অনুচ্ছেদে, আপনাকে দেওয়া তথ্যের ডেটা ব্যবহার করে প্রধান বৈশিষ্ট্যগুলিকে সমর্থন করুন।
Check your work– আপনার রিপোর্টটি বানান এবং ব্যাকরণগত ভুলগুলির জন্য পরীক্ষা করুন। নিশ্চিত করুন যে আপনি উল্লেখ করা ডেটা সঠিক!
Avoiding Mistake
IELTS Writing Task 1 এ অনেক সাধারণ ভুল দেখা যায়। প্রথমত, পরিসংখ্যান ভুল করা একটি বড় সমস্যা। সঠিক সংখ্যা এবং ডেটা ব্যবহার করা খুবই গুরুত্বপূর্ণ। দ্বিতীয়ত, কিছু প্রার্থীরা তথ্য পর্যবেক্ষণ করতে ভুল করে। তথ্য বিশ্লেষণ করতে হবে সঠিকভাবে।
লেখার পর, অবশ্যই সম্পাদনা ও সংশোধন করতে হবে। এটি ভুল কমায় এবং উচ্চতর স্কোর আনতে সাহায্য করে। আবার পড়ে দেখুন এবং প্রতিটি বাক্য পরীক্ষা করুন। এমনকি ছোট ভুলও সংশোধন করুন। ভুল শব্দ এবং বাক্য গঠন ঠিক করুন।
Frequently Asked Questions
How To Answer Ielts Writing Task 1?
IELTS লেখার টাস্ক ১ উত্তর দিতে চার্ট বা গ্রাফ বিশ্লেষণ করুন। প্রধান বৈশিষ্ট্যগুলি উল্লেখ করুন। তুলনা এবং প্রবণতা বর্ণনা করুন। সংক্ষেপে উপসংহার টানুন।
How To Start Ielts Writing Task 1?
IELTS লেখার টাস্ক ১ শুরু করতে প্রথমে গ্রাফ বা চার্টটি মনোযোগ দিয়ে পড়ুন। প্রধান বৈশিষ্ট্যগুলি চিহ্নিত করুন। এরপর একটি পরিচিতিমূলক বাক্য লিখুন যা তথ্যটি বর্ণনা করে। তথ্যগুলির মধ্যে তুলনা করুন এবং গুরুত্বপূর্ণ প্রবণতাগুলি উল্লেখ করুন। সংক্ষেপে উপসংহার টানুন।
How To Get Band 9 In Ielts Writing Task 1?
IELTS রাইটিং টাস্ক ১-এ ব্যান্ড ৯ পেতে হলে তথ্য সঠিকভাবে বিশ্লেষণ করুন, পরিষ্কার গ্রাফ ব্যবহার করুন, সংক্ষিপ্ত বাক্য লিখুন, এবং বানান ও ব্যাকরণে সাবধানতা অবলম্বন করুন। প্রতিটি গুরুত্বপূর্ণ দিক কভার করুন এবং টাস্ক রেসপন্সে মনোযোগ দিন।
How Many Paragraphs Should I Write In Ielts Task 1?
IELTS Task 1-এ সাধারণত ৪টি প্যারাগ্রাফ লিখুন। প্রথমে ভূমিকা, তারপর ওভারভিউ এবং শেষে দুটি বিস্তারিত প্যারাগ্রাফ।
Conclusion
IELTS Writing Task 1 এ ভালো ফলাফল পেতে নিয়মিত অনুশীলন করুন। গ্রাফ, চার্ট এবং ডায়াগ্রাম বিশ্লেষণে দক্ষতা বাড়ান। সময় ব্যবস্থাপনাও গুরুত্বপূর্ণ। প্রতিটি অনুশীলনের পর নিজেকে মূল্যায়ন করুন। আশা করি এই উদাহরণ আপনাকে প্রস্তুতিতে সাহায্য করবে। ভালো ফলাফলের জন্য মনোযোগ দিন এবং সফল হোন।